

2017 Tax Bill
The Tax Bill
An Epic Battle Between Pure Speculation and Absolute Certainty
(Revised 12/22/2017 to reflect the final tax bill as signed into law)
by Vincent F. Lackner, Jr.
“Most people, including members of Congress, are generally aware that the proposed tax overhaul is tilted heavily toward the wealthy. Yet they do not understand how profoundly it would favour them, rather than “middle class” taxpayers who were supposed to be its primary beneficiaries. The tax “visualizations” contained in this article, derived from mathematical analysis, deliver instantaneous and powerful evidence of that result.“
Vincent F. Lackner, Jr., J.D., President The Lackner Group and Principal of Leimberg, LeClair & Lackner provides members with his commentary on the Tax Cuts and Jobs Act of 2017.
Mr. Lackner is founder and President of The Lackner Group, Inc., in Pittsburgh, PA (www.lacknergroup.com). He is the primary author of The 6-in-1 Estate Administration System, first released in 1986 and currently relied upon by nearly 1,500 users in law firms, accounting firms, and banks throughout the United States. He received his undergraduate degree from Harvard University and his law degree from New York University School of Law.
Here is his commentary:
Executive Summary
The “Tax Cuts and Jobs Act of 2017” (“TCJA”) has been heavily marketed as a “middle-class” tax cut.
By way of comparison, the term “blue sky” law was first coined in Kansas in 1910, as reflected in this passage from Hall v. Geiger-Jones Co., 242 U.S. 539 (1917), addressing the constitutionality of state securities laws:
The name that is given to the law indicates the [problem] at which it is aimed, that is, to use the language of a cited case, “speculative schemes which have no more basis than so many feet of ‘blue sky'”; or, as stated by counsel in another case, “to stop the sale of stock in fly-by-night concerns, visionary oil wells, distant gold mines and other like [problematic] exploitations.”
I have substituted in “[problem]” or “[problematic]” for the original words, so that those who generally support the TCJA will continue reading this article.
None of the marketing for TCJA that I have seen during the past eight weeks says a word about an “upper-class” tax cut. Yet this is the real story.
Who gets what
$$ tax cut per taxpayer
2018
Middle Class(i): $ 1,370
Top 0.1%(ii): $ 193,380 ( 141x the average tax cut for the middle class )
2027
Middle Class: $ 5
Top 0.1%: $148,260 (29,652x the average tax cut for the middle class
The Top 0.1% number for 2018 reflects the additional tax cut of$131,460 ($61,920 => $193,380), per taxpayer, resulting from the further reduction of the top individual income tax rate from 38.5% to 37% (Conference Committee, Friday, December 15, 2017)(iii).
Tax cut as percent of INCOME
2018
Middle Class(i): 1.50%
Top 0.1%(ii): 1.82% ( 1.22x the average tax cut for the middle class )
2027
Middle Class(i): 0.0041%
Top 0.1%(ii): 0.93% ( 224.76x the average tax cut for the middle class )
Tax cut as percent of TAX
2018
Middle Class(i): 9.07%
Top 0.1%(ii): 4.83% ( 0.53x the average tax cut for the middle class )
2027
Middle Class(i): 0.03%
Top 0.1%(ii): 2.71% ( 95.13x the average tax cut for the middle class )
It would appear, then, that such a tax bill is not a “middle-class” tax cut. Instead, it is an “upper cut” to the middle class.
Background
At 6:45 pm on Thursday, September 28, 2017, I got into a discussion with a neighbor at a community cocktail reception about the effect of the estate tax on small businesses and farms. The neighbor was all in on President Trump’s claim (and was shocked that I should believe IRS statistics to the contrary):
To protect millions of small businesses and the American farmer, we are finally ending the crushing, the horrible, the unfair estate tax, or as it is often referred to, the death tax. (9/28/2017).
This led me to some research that confirmed that the true number of small businesses and farms affected by the estate tax was somewhere between 50 and 80 per year. Thus, assuming that “millions” means at least two million, the President overstated his claim by a factor of somewhere between 25,000 and 40,000.
At 10:13 am on Thursday, November 2, 2017, I received the following text message from http://fairandsimple.gop
Bigger Paychecks: Americans’ taxes are too high, so we are lowering individual tax rates for low- and middle-income Americans and eliminating excessive, costly taxes. That means you get to keep more of your hard-earned paychecks.
Finally, at 6:45 pm on Friday, December 15, 2017, I received the following text message from the same http://fairandsimple.gop
The biggest news of the day: middle class families are on the brink of a big tax cut. Tax cut = more money in your wallet. Read the latest version of the Tax Cuts & Jobs Act.
Pure Speculation
The proposed tax bill is projected to increase the deficit by $1.5T over 10 years, without regard to any economic growth generated by the bill.
This would increase the current deficit (“Gross National Debt”) from $20.6T to approximately $22.1T.
It’s been all over the news that the White House expects this bill to pay for itself, and even start reducing the deficit. This is based on projections for sustained economic growth of 3.5% to 4% (or even 5% or 6%, per our FCIC(iv)), with support provided by a one-sheet document with no backup. Virtually no economist (other than the Tax Foundation’s Special Report No. 240, Nov. 2017) agrees with these projections.
The JCT and CBO project that the tax bill will increase the deficit by $1.45T.
The JCT further estimates that tax bill could generate enough growth to create nearly $408B in net new revenue.
Thus, the net increase to the deficit would still be slightly more than $1T.
Will the tax cuts pay for themselves during the next 10 years? Maybe, maybe not. There is no evidence. It’s never happened before. It’s pure speculation.
Absolute Certainty
What is absolutely certain, however, is that the proposed tax bill favors the rich, profoundly so.
For the past eight weeks, I have been studying a wide variety of materials in connection with the proposed tax bill. During that time I have reviewed more than 100 articles, studies, and reports, and pored over more than 100 tables, charts, and graphs. Sources for major studies and reports included the following:
Joint Committee on Taxation (“JCT”)
Tax Policy Center (“TPC”)
Institute for Taxation and Economic Policy (“ITEP”)
Tax Foundation (“TF”)
Congressional Budget Office (“CBO”)
IRS Statistics of Income for Tax Year 2015 (returns filed in 2016)
The House passed its bill on November 16, the Senate its initial bill on December 2, and the Conference Committee its “final” version on December 15. The final bill was passed by both the Senate and the House on December 20 and signed by the President on December 22.
Reconciling these sources has been a dizzying process.
During the last several days, however, I have extended the math contained in the Tax Policy Center’s 12/18/2017 “Distributional Analysis of the Tax Cuts and Jobs Act as Passed by the Senate”(on 12/15/2017).
On the theory that “a chart is worth a thousand words” (thank you, Deborah Jacobs), I have “visualized” this math on five colorful charts that tell the story almost instantly. The charts appear at the end of this article, with brief comments.
I strongly encourage you to view these charts online at Tableau Public:
https://public.tableau.com/app/profile/vincelackner/viz/TaxBillViz/Story
Be sure to click on the full-screen icon in the lower right corner, then click on the ficve tabs along the top.
These numbers are approximations, using a best effort to synthesize dozens of sources for this information.
Here is a breakdown of the average tax cuts, per person, by three major groups:
2018
Lowest Quintile(v): $ 60 (about 50 million taxpayers)
Middle Class: $ 1,370 (60-65 million taxpayers, 3rd & 4th quintiles)
Top 0.1%: $ 193,380 (120,000 taxpayers)
2025
Lowest Quintile: $ 70
Middle Class: $ 1,295
Top 0.1%: $ 252,300
2027
Lowest Quintile: $ (16) (tax increase)
Middle Class: $ 5
Top 0.1%: $ 148,260
Miscellaneous
By design, this article has focused on the tax bill itself, and not on the larger economic, political, philosophical, and moral issue of wealth and income inequality.
There is, however, a fascinating video published in 2012 and viewed nearly 21M times. It is called “Wealth Inequality in America”, and runs for just over six minutes. It’s worth watching:
Also, of the more than 4,000 news articles currently available Google News in connection with the tax bill, I found the following article particularly interesting:
Summary
Without the tax “visualizations” contained in this article, however, it is virtually impossible for anyone to realize how profoundly this bill is tilted toward the wealthy and away from everyone else (including the “middle class” that was supposed to be its primary beneficiary).
Exactly 100 years after the Supreme Court decision in Hall v. Geiger-Jones Co., the country now has a new tax law that isn’t what it is claimed to be (“middle-class tax cut”), promises economic growth at rates which have never happened and for which there is no evidence, is likely to increase the national deficit by $1-1.5T in order to shift vast amounts to the wealthy and super-wealthy who do not need it, and may in fact represent “a speculative scheme” that has “no more basis than so many feet of ‘blue sky’.”
Charts
Chart #1
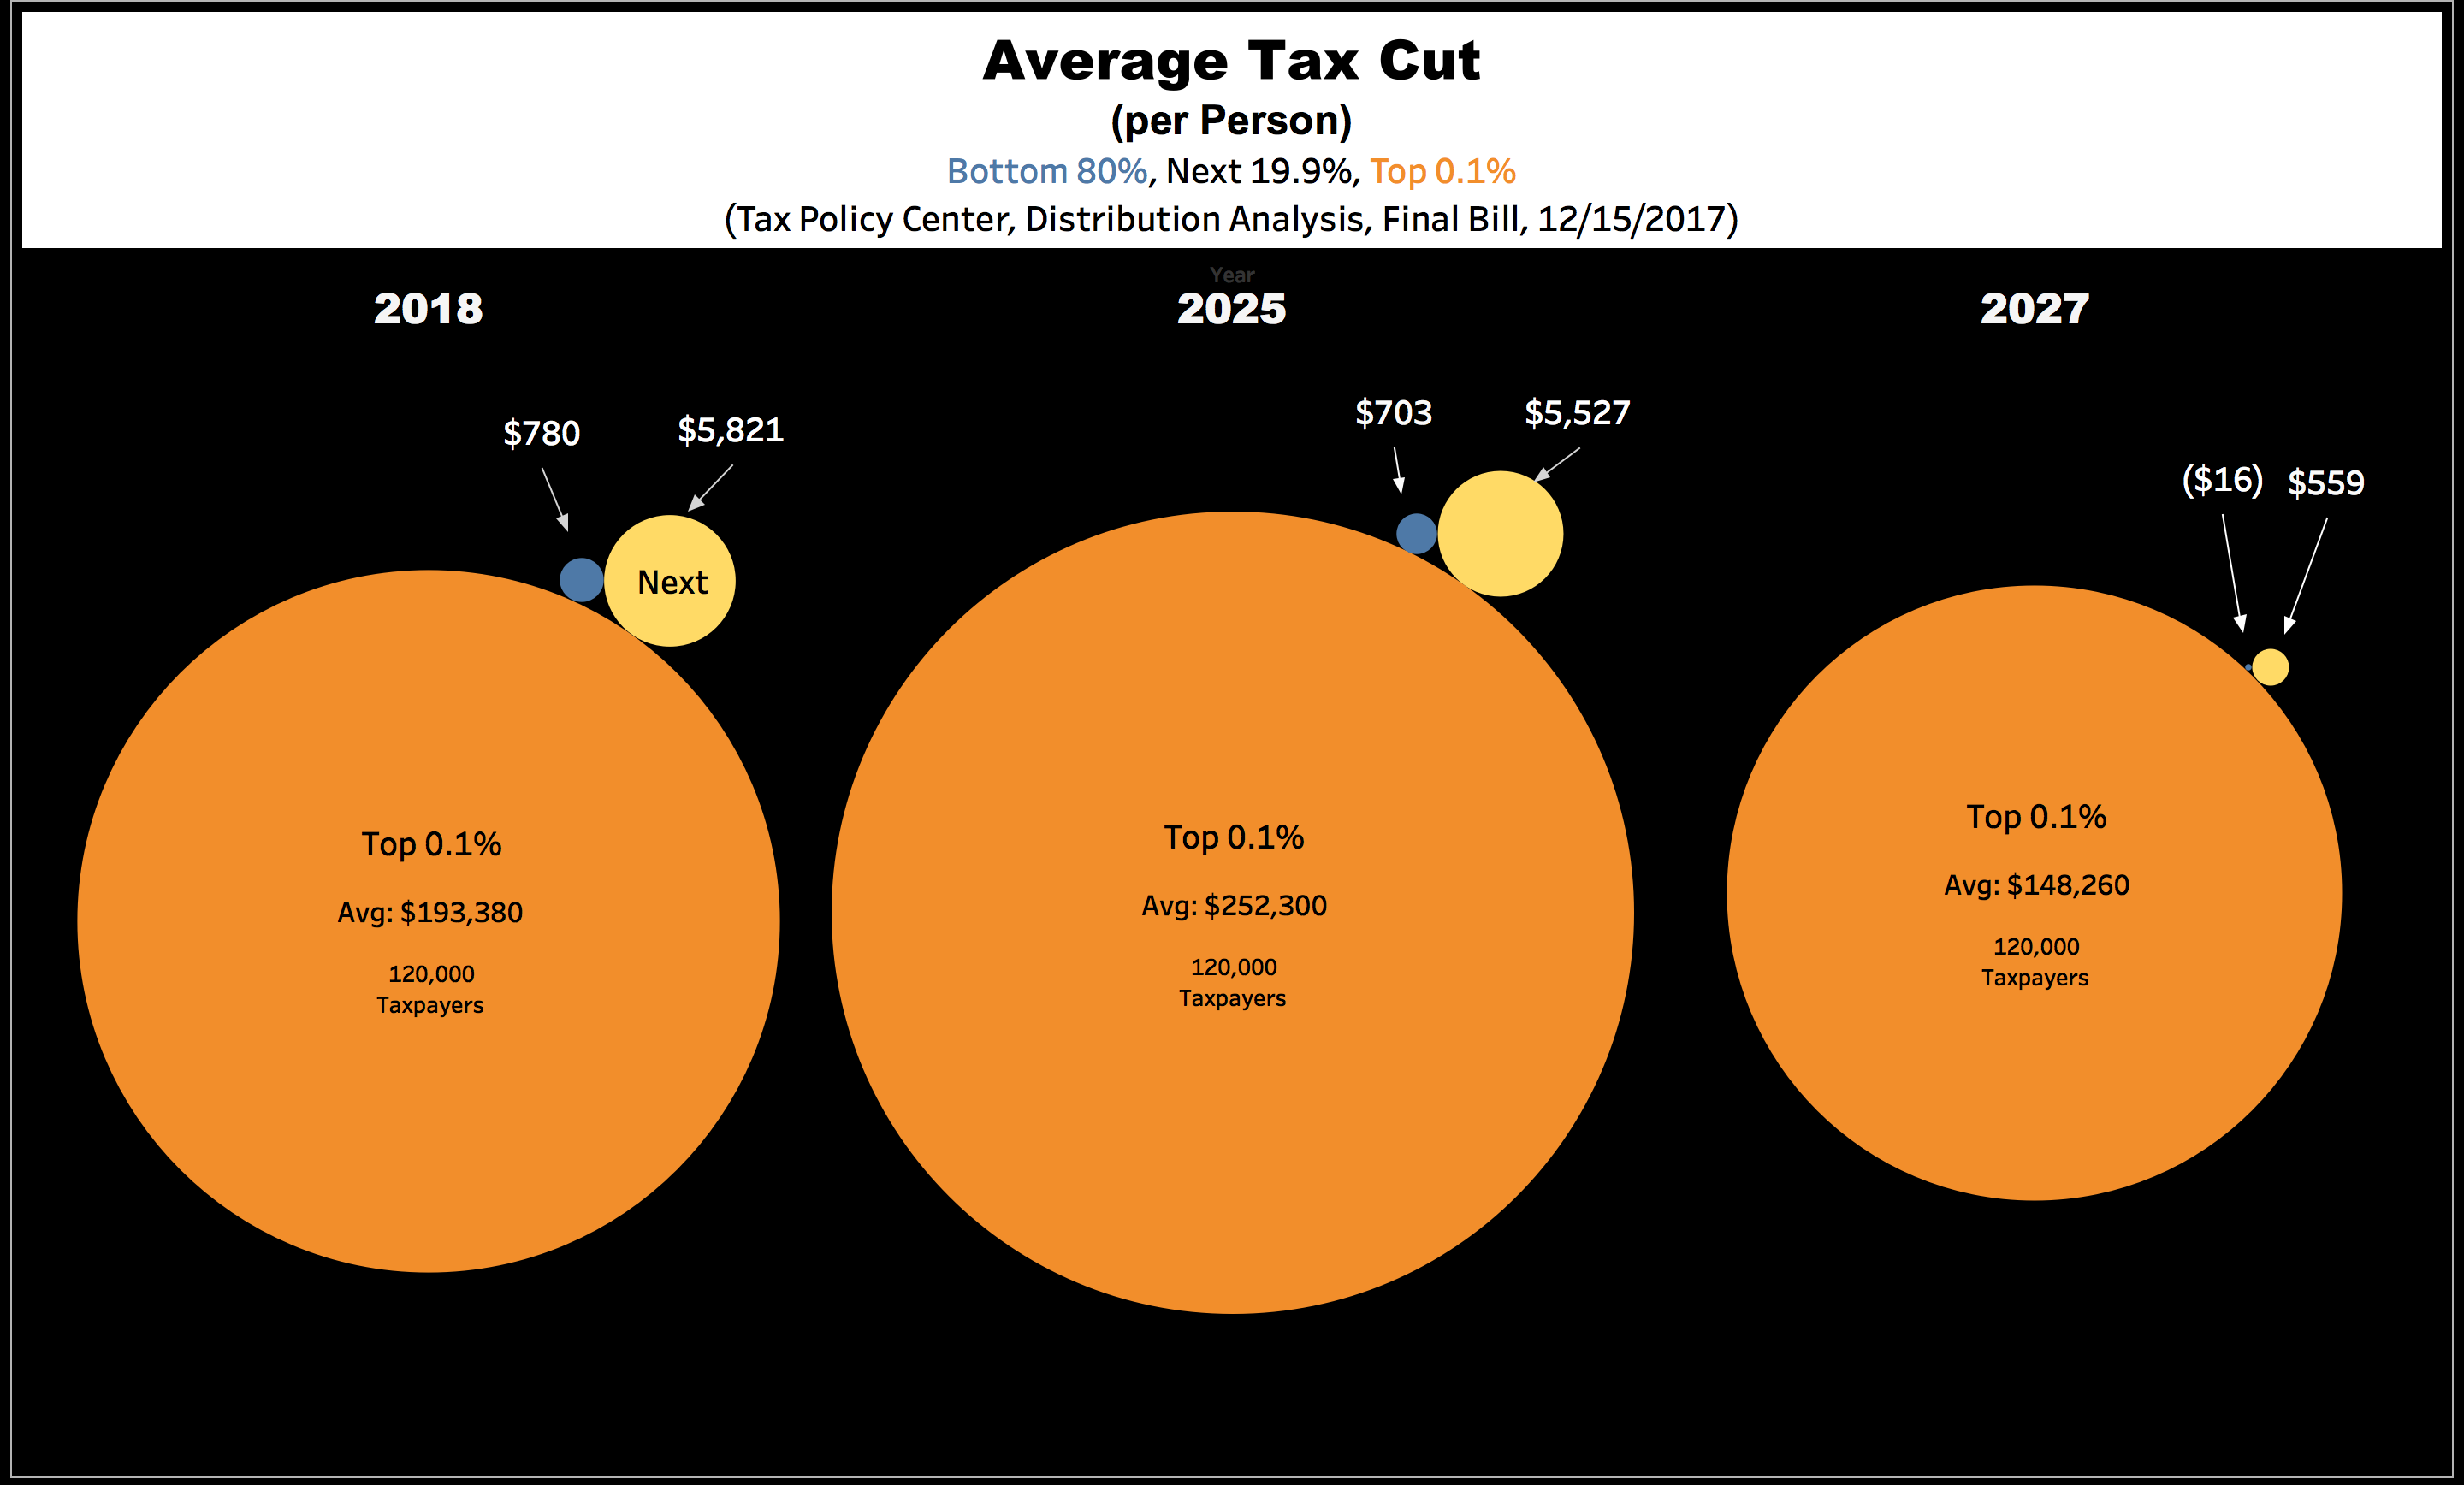
Chart #1: Average $$ Tax Cut (per person) in the Bottom 80% (bottom four quintiles), Next 19.9%, and Top 0.1% (120,000 taxpayers) (packed bubbles).
Note that, in 2027, each taxpayer in the Top 0.1% will enjoy a tax cut of $148,260, while each taxpayer in the Bottom 80% will suffer a tax increase of $16. In fact, the lowest quintile will suffer a tax increase of $30 each, the second quintile a tax increase of $40 each, and the third quintile a tax increase of $20 each.
Chart #2
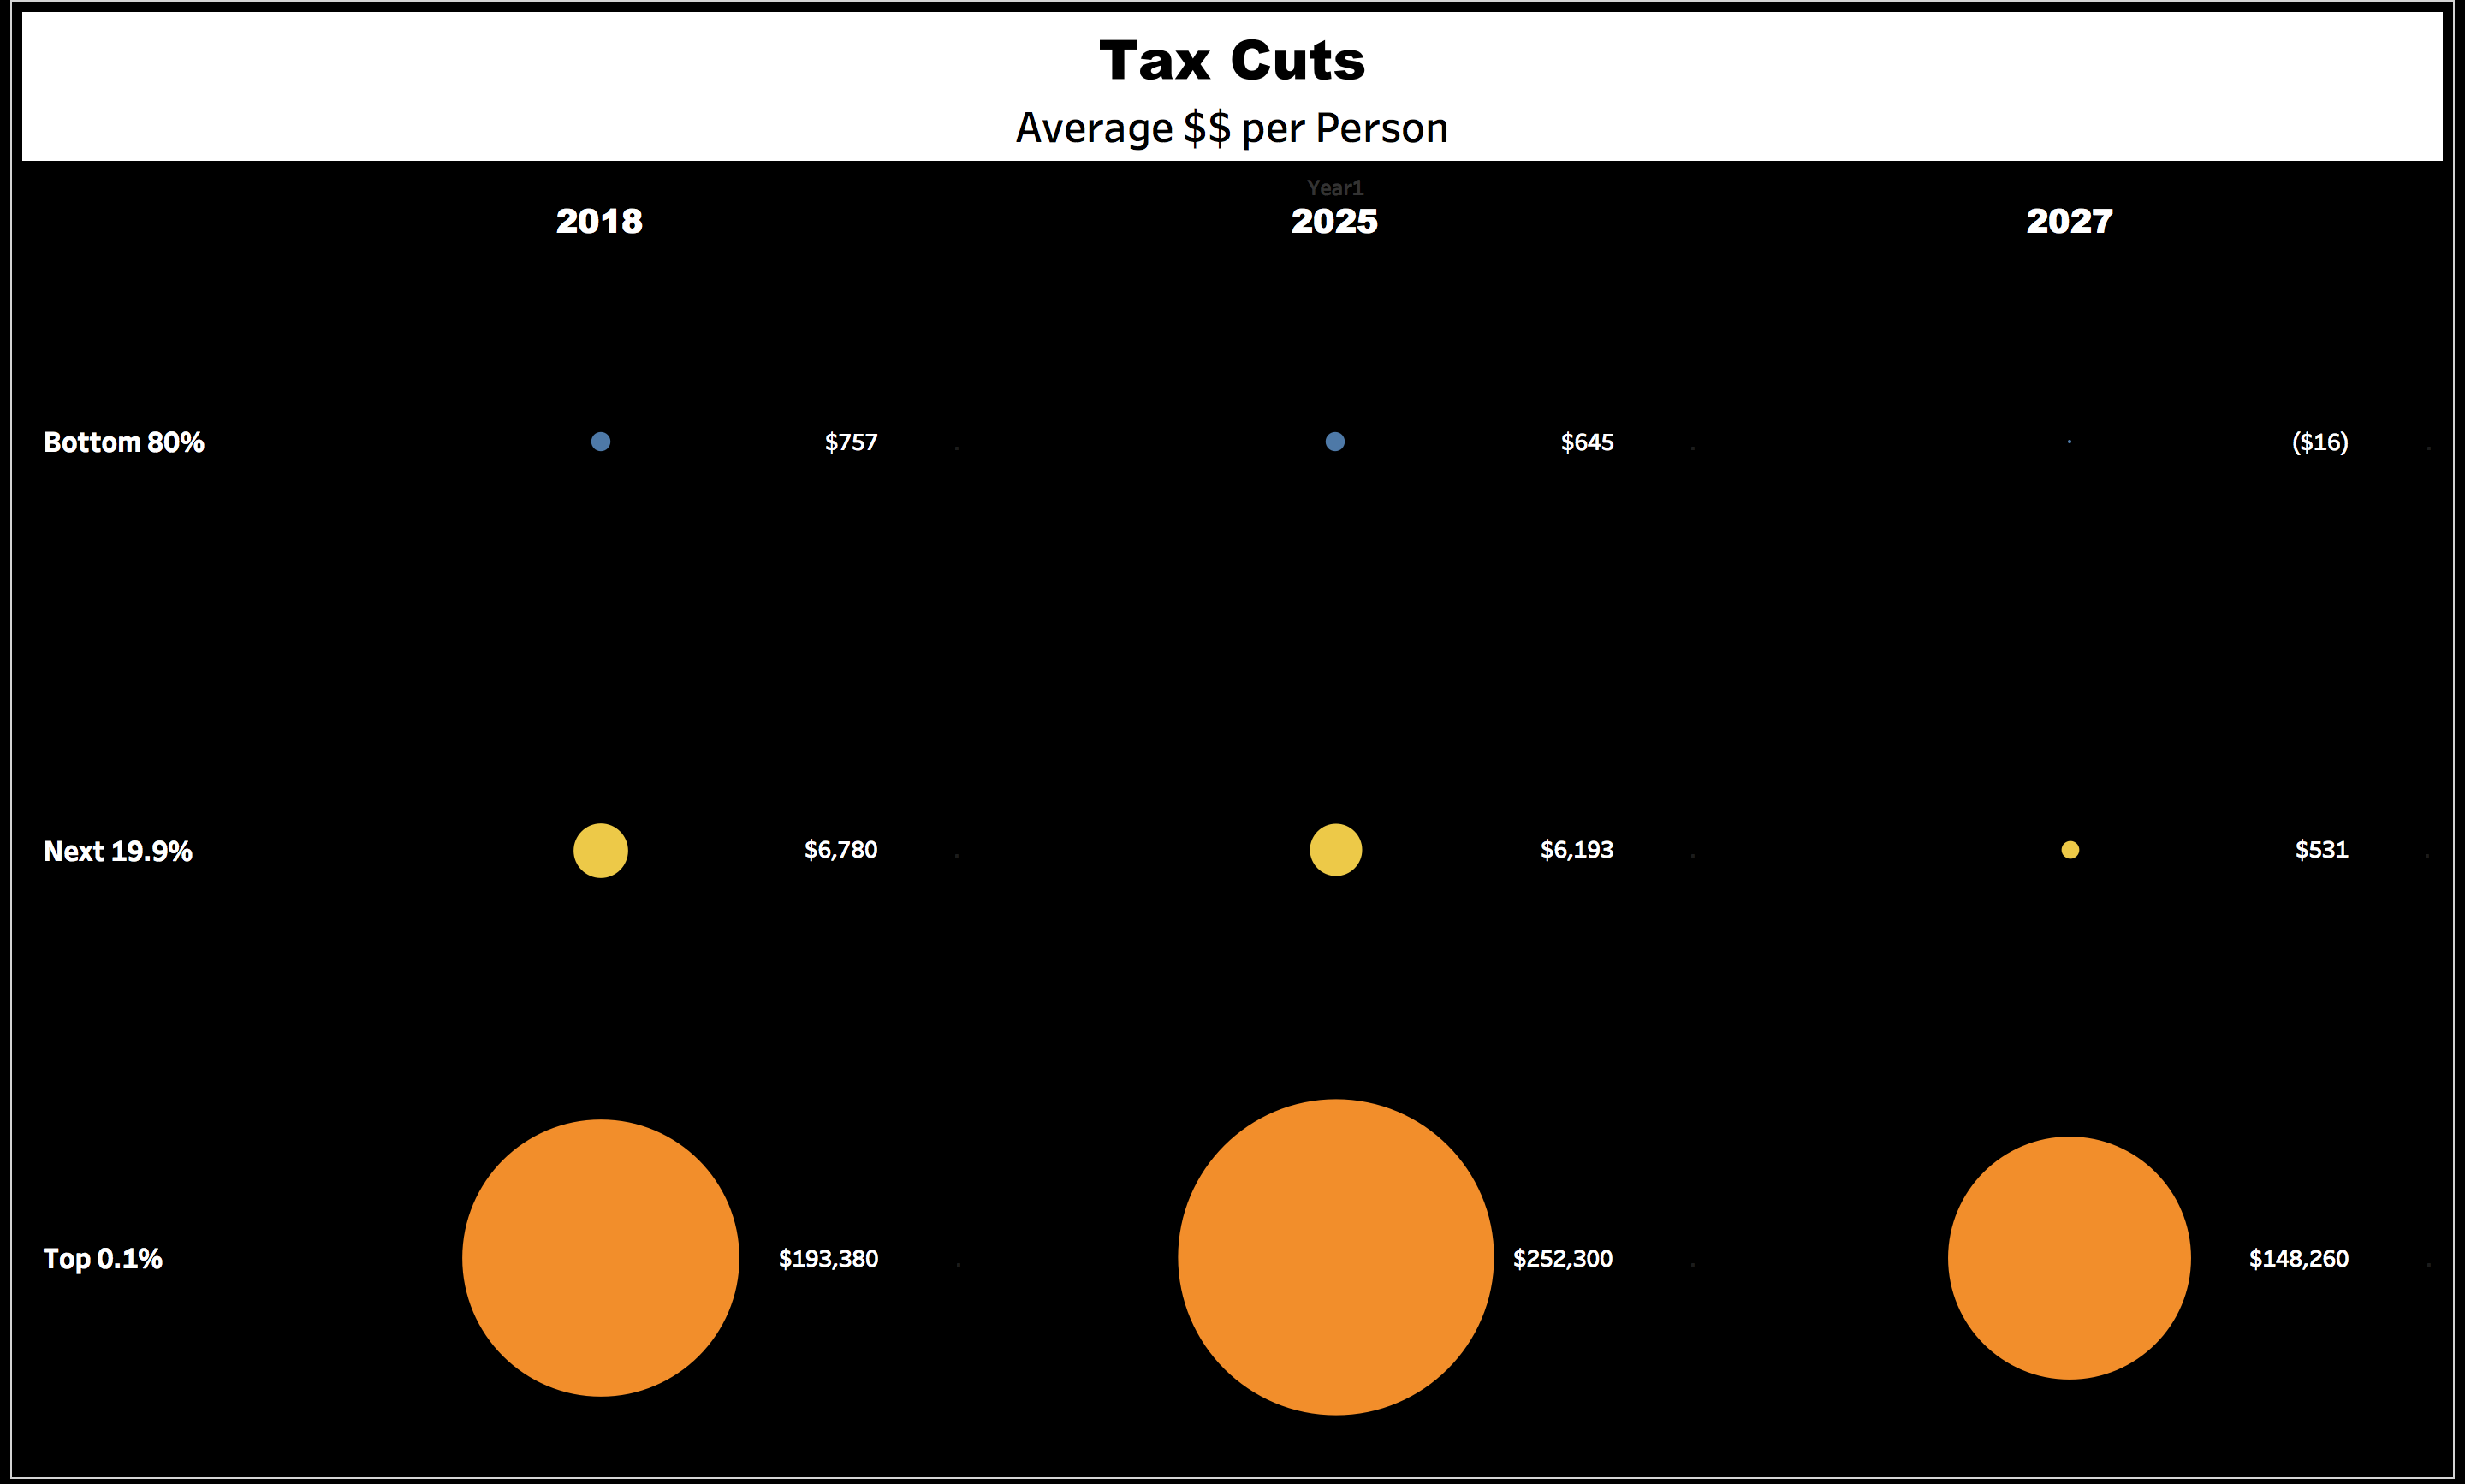
Chart #2: Average $$ Tax Cut (per person) (separate bubbles). Note that, in 2027, the circle in the lower right corner for the Top 0.1% ($148,260 tax cut per person) is the largest one, and the circle in the upper right corner for the Bottom 80% (bottom four quintiles) ($16 tax increase per person) is imperceptible.
Chart #3
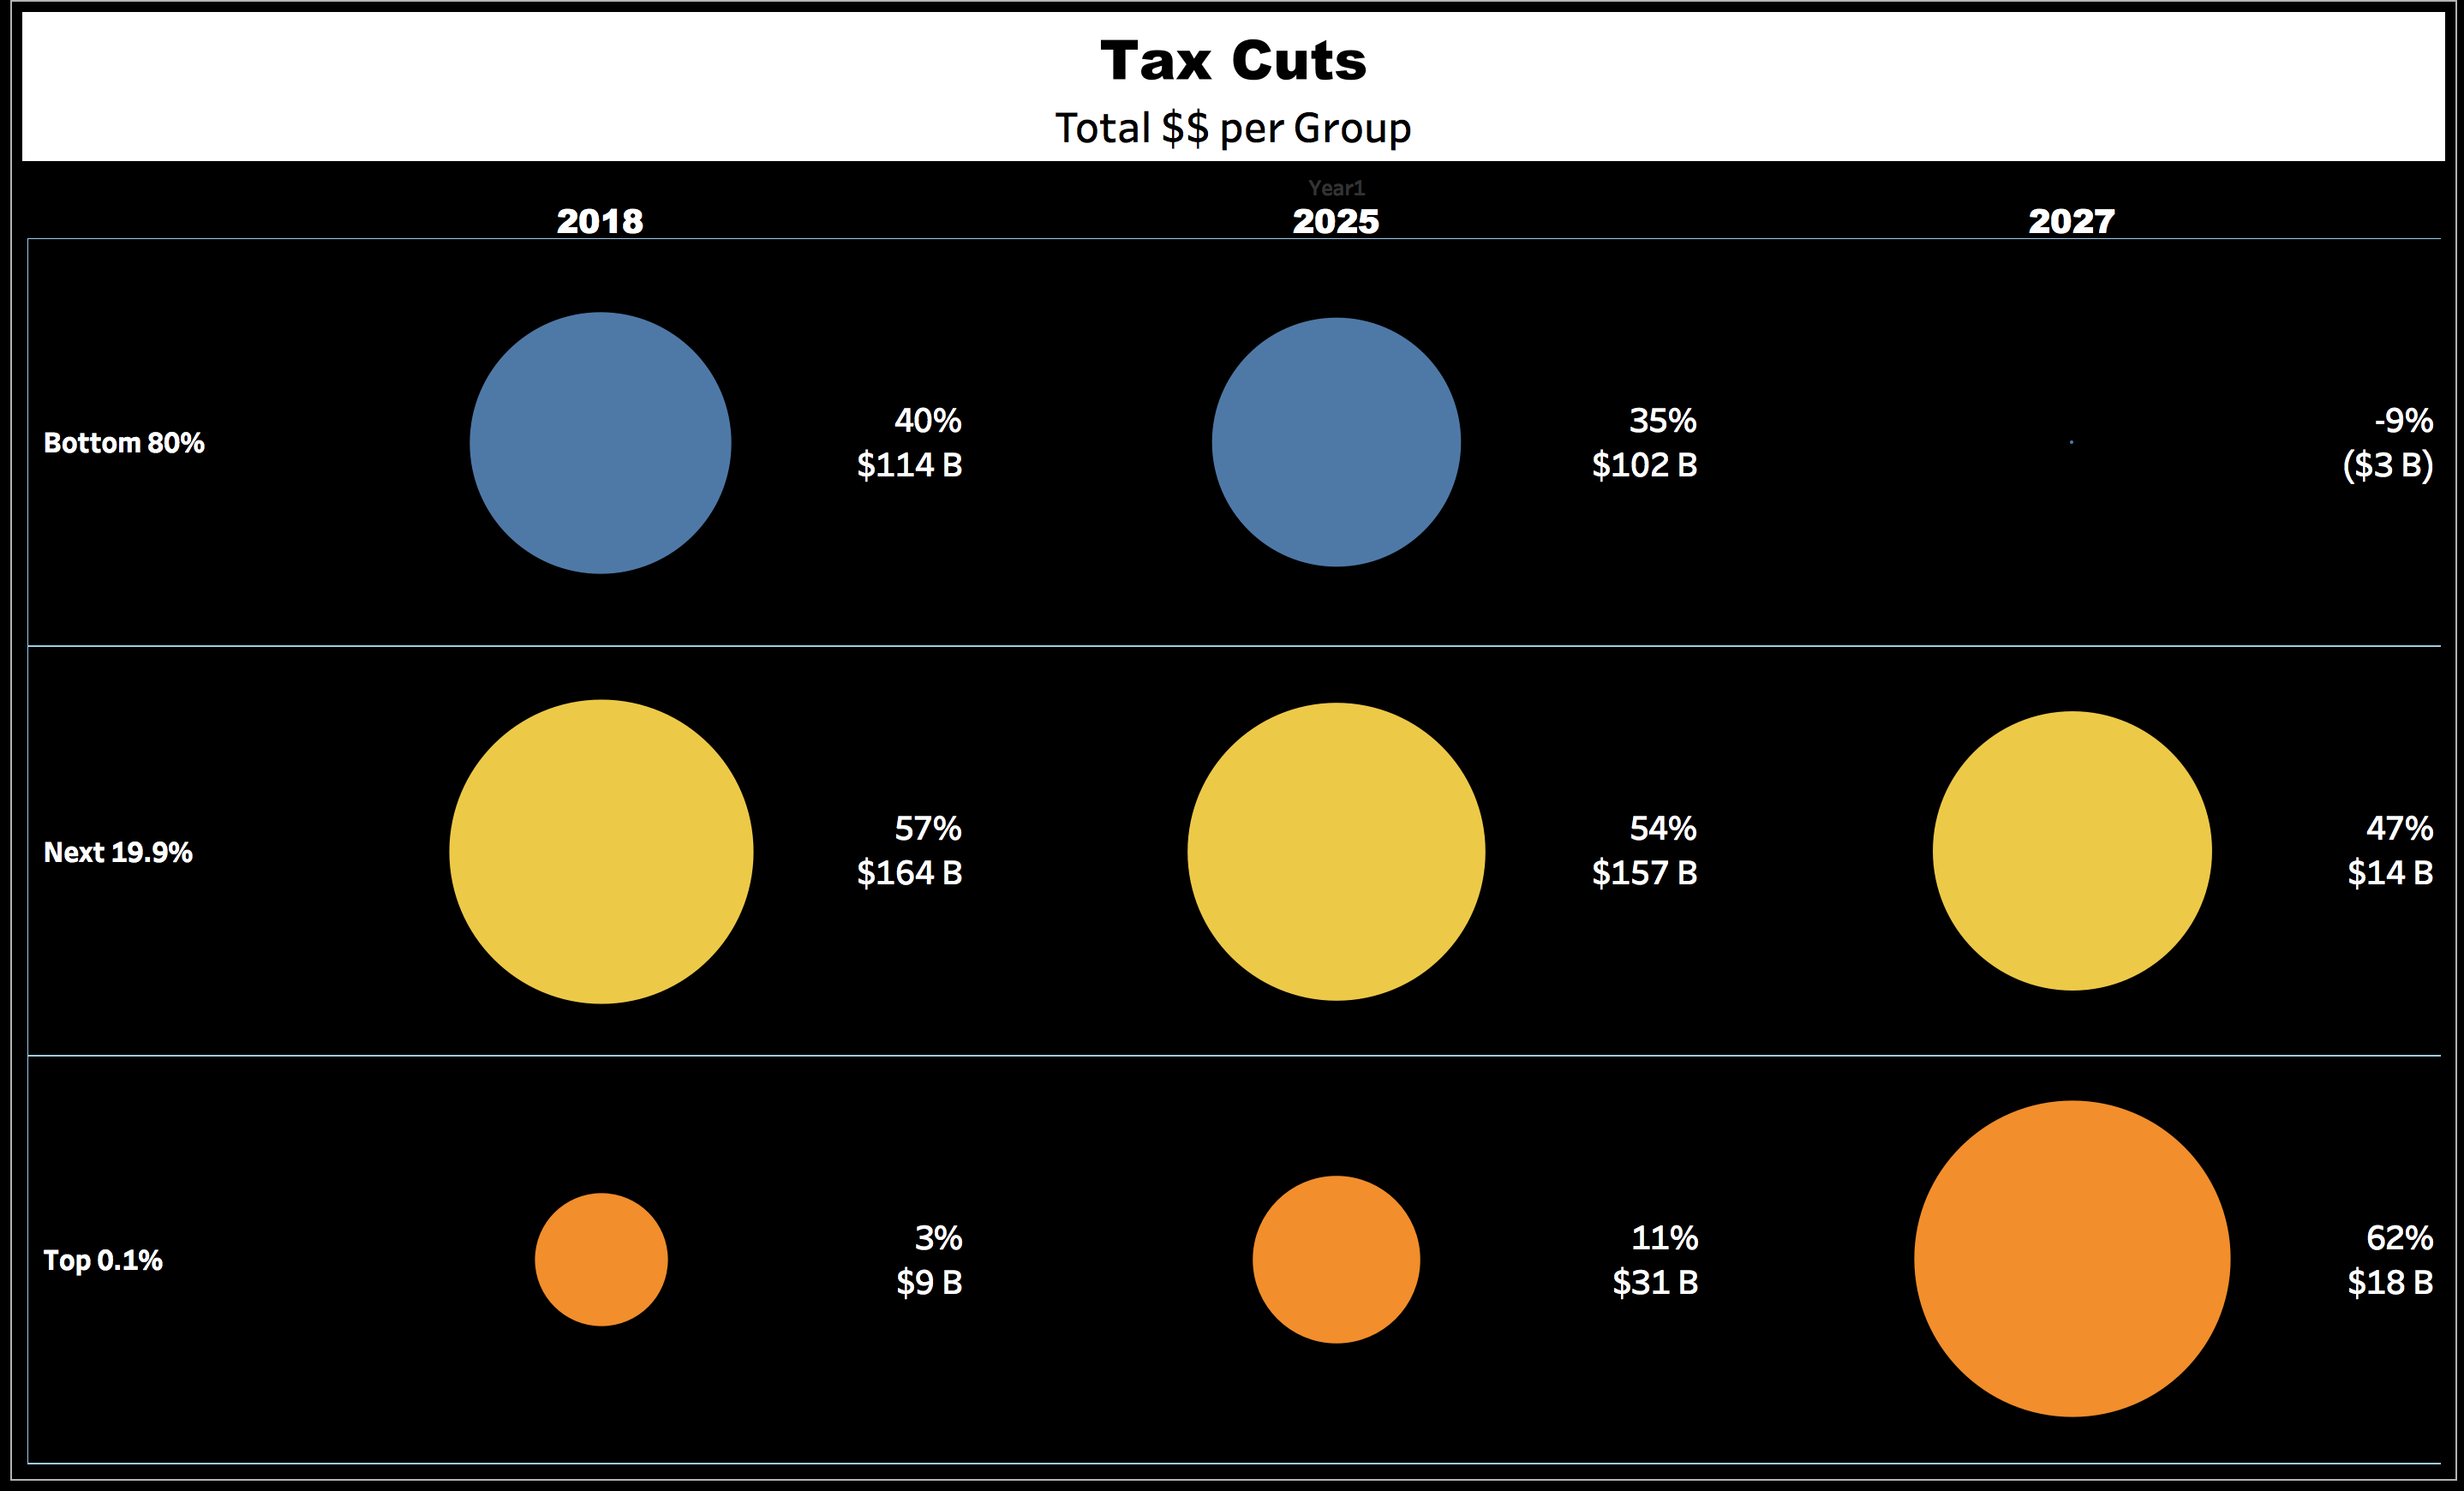
Chart #3: Total $$ Tax Cuts per Group. Note that the Bottom 80% goes from a tax cut of $114 B (2018) to a tax increase of $3 B (2027),while the Top 0.1% goes from a tax cut of $9 B (2018) to a tax cut of $18 B (2027).
The percentage of the aggregate tax cuts for these two groups is more than flipped: Bottom 80% goes from a tax cut of 40% (2019) to a tax increase of 9% (2027), and the Top 0.1% from a tax cut of 3% (2019) to a tax cut of 62% (2027).
Chart #4

Chart #4: Tax Cuts as % of INCOME. This addresses the argument from defenders of the TCJA that the wealthy have more INCOME, so they should get a proportionally larger share of tax cuts.
Note, however, that in 2027, the Top 0.1% gets a tax cut equal to 0.92% of income, whereas the Bottom 80% gets a tax increase equal to 0.03% of income.
Chart #5
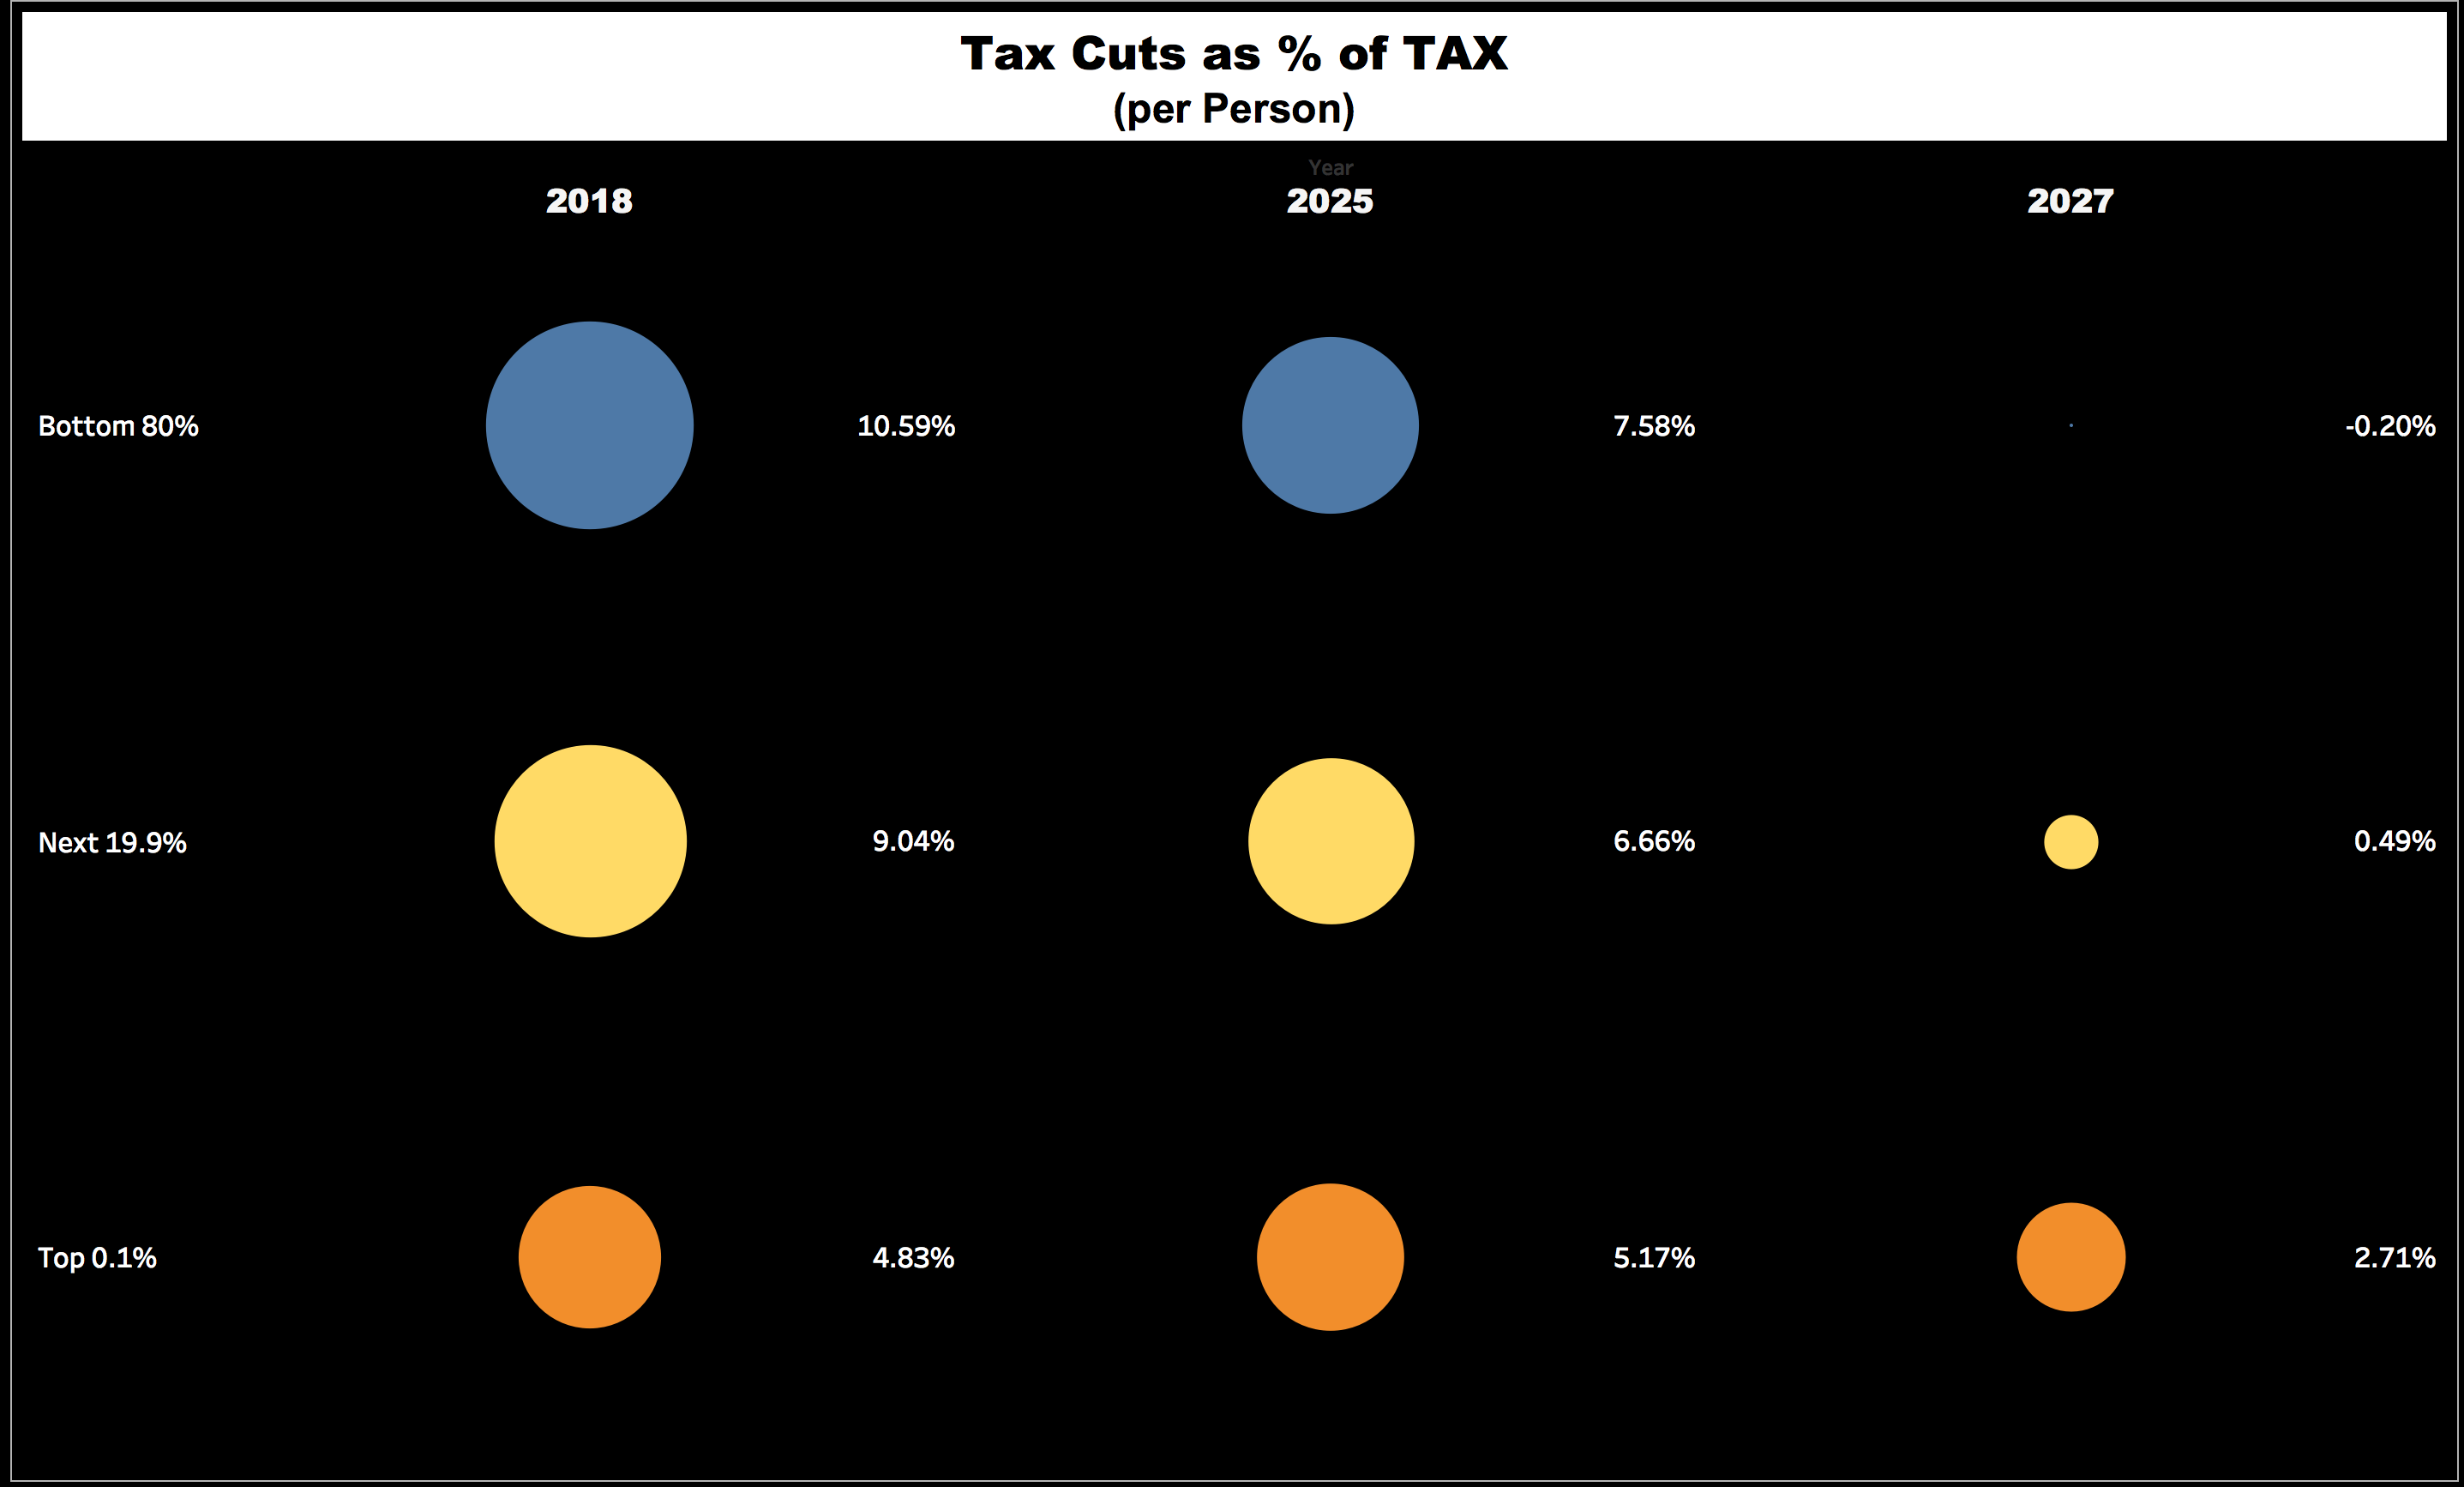
Chart #5: Tax Cuts as % of TAX. This addresses the argument from defenders of the TCJA that the wealthy pay more TAX, so they should get a proportionally larger share of tax cuts.
Note, however, that in 2027, the Top 0.1% gets a tax cut equal to 2.71% of tax paid, whereas the Bottom 80% gets a tax increase equal to 0.20% of tax paid.
HOPE THIS HELPS YOU HELP OTHERS MAKE A POSITIVE DIFFERENCE!
Vince Lackner
CITE AS:
LISI Estate Planning Newsletter #2610 (December 18, 2017) at http://www.leimbergservices.com Copyright 2017 Leimberg Information Services, Inc. (LISI). LISI members are urged to forward this commentary to their clients/media sources or anyone else they would like to provide copies for republication.
CITATIONS:
i Middle Class: approximately the third and four quintiles(v) , about 65M people
ii Top 0.1%: approximately 120,000 people
iii Corporate Top Rate Now at 21%: Because the individual tax cuts expire after 2025, the 2027 number does not reflect any reduction from the existing top rate of 39.6%. Per the TPC Microsimulation Model, it reflects the “cash income” benefit to the Top 0.1% from the permanent corporate top tax rate reduction from 35% to 21%.
iv FCIC: Fact-Checker-in-Chief
v Quintile: Per the Tax Policy Center’s “Microsimulation Model” (version 0217-1), “quintiles” are measured by “tax units” rather than “taxpayers”, and therefore do not represent 20% of taxpayers in each quintile. Instead, “tax units” generally reflect the number of people in a given household who are dependents on the primary taxpayer. Thus, the lowest quintile consists of about 49M tax units, whereas the top quintile consists of about 25M tax units. In simplest terms, multiplying tax units by the number of dependents would result in an equal 20% of taxpayers in each quintile (but the actual formula is a little more complicated). Several charts refer to the “Bottom 80%”, but they really mean the “Bottom Four Quintiles”.
The AGI ranges for each quintile for 2018 (based on 2017 dollars) are as follows (TPC Table T17-0001, Income Tax Breaks, 2011-27):
| Low | High | |||
| 1st quintile: | 0 | 25,000 | ||
| 2nd quintile: | 25,001 | 48,600 | ||
| 3rd quintile: | 48,601 | 86,100 | ||
| 4th quintile: | 86,101 | 149,400 | ||
| 5th quintile: | 149,401 | |||
| 80% => 90% | 149,401 | 216,800 | ||
| 90% => 95% | 216,801 | 307,900 | ||
| 95% => 99% | 307,901 | 732,800 | ||
|
99% => 99.9% | 732,801 | 3,439,900 | ||
| 99.9% => 100% | 3,439,901 |